Market Trends Review & Forecast
As we look ahead, the trajectory of the pandemic and vaccine rollout will undoubtedly shape the 2021 economic landscape. Moody’s Analytics reports retailers should see notable gains, forecasting 6.2% growth in core retail sales through 2021. During the first half of 2021, households will likely continue to self-quarantine and a wave of bankruptcies will increase the number of permanent job losses. Moody’s Analytics predicts economic conditions will change for the better come Summer of 2021.

The University of Michigan’s consumer sentiment for the US recorded at 83.0 in March 2021. This increase exemplifies that consumer confidence is on the road to recovery as shutdown restrictions have been drastically lifted with the economy continuing to rebound as business re-open. Despite job lose
and salary disparities as a result of COVID-19, a significant gain in spending is expected to be seen towards the end of 2021 due to both increased consumer accumulated savings and widespread government stimulus payments.
Despite the substantial shifts in consumer spending in 2020 and beginning of 2021 caused by COVID-19, US Retail and Food Service increased by 27.7% YOY as of March 2021, proving the resilience of the overall retail industry. Retail trade sales recorded an increase of 26.9% YOY while motor vehicle and parts were up 71.1%. As we focus on 2021 and beyond, here are a few key indicators to note as the retail industry continues to adapt to pandemic-driven changes.
2021 Key Indicators
QSR Pivot Shifts
- “Go Mobile” Digital Only Store Locations
- More Drive Thrus (2-3 Lanes) and Smaller Dining Rooms
- Contactless Payment/License Plate Recognition
Grocery Stores
- Digital Orders/Contactless Payment
- New Contactless Services/Smoothie Making Machines & Salad Robots
- Ecommerce Grocery Landscape Transformation
Evolving Customer Behavior
- Live Streaming Shopping/Social Commerce
- Ecommerce Sites & Contactless Payment
New Amazon Platforms
- Amazon 4 Star
- Amazon Fresh
- Amazon Pop-Up
- Amazon Go
US RETAIL RENT COLLECTIONS RETURN TO PRE-PANDEMIC LEVELS

2021 Economic Review & Forecast
COVID-19 Vaccination | 39.6 Million People in the U.S. Have Received Their First Dose
Startups are Growing | 1.1 Million New Business Applications in 4Q/2020
Evolving Work Force Environment | Remote Work & Space Hybrid Conversions
$2 Trillion in Savings Deposits | Americans Accumulated Since February 2020
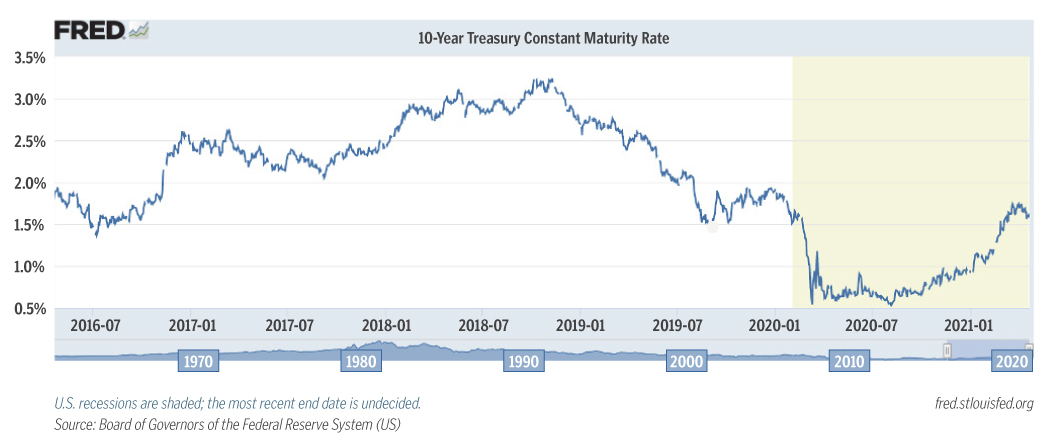
10-Year Treasury Note | expected to rise to near 2% in 2021, up from the current rate of 1.1%* This increase could create challenges for buyers to obtain ideal financing.
Inflation | expected to rise 2.7% in 2021, up from 1.7% in 2020*
GDP | expected to grow 6.2% in 2021, up from -5.8% growth in 2020*
*Source: Kiplinger Forecast & Reuters
The yield on the 10-year Treasury note got an extra boost in Q1, as economic conditions have mended and Congress began to roll out a third stimulus payment. Yields also ticked up as initial unemployment claims declined. Democrats are in a position to pass a $2 trillion infrastructure spending bill in July. This additional aid to funds is expected to boost economic growth and push up both inflation and interest rates. The 10-year Treasury rate is expected to rise to at least 2% by the end of this year.
National NNN Retail Cap Rates by Location Type

Average Summary Report – Cap Rates by Industry Sector
For this report, SRS reviewed Q1 2021 sales reported by Costar for the following sectors: Automotive, Bank, Big Box/Superstore, Casual Dining, C-Store/Gas, Dollar Stores, Educational (Childcare), Fast Casual, Grocery, General Retail, Medical STNL, Pharmacy, and QSR. In today’s market, it’s especially important to understand the impact the ongoing pandemic has had on the relationship between length of lease term and capitalization rates across all product types, as well as how the pandemic has affected buyer bias toward certain sectors. To do so, we compiled the following average summary reports for a number of data points throughout each mentioned sector. As can be expected, sectors classified as “essential business” with more capabilities to adapt to a changing marketplace have been less affected than others. *Note: this report captures data only for transactions which have reported a sale price and capitalization rate. The following data has been collected from sources deemed reliable; it may not include confidential and/or proprietary information of the marketplace.
AUTOMOTIVE
In comparison to the economic depths experience in the spring 2020, the auto industry rebounded in new-vehicle sales. Consumers have shifted toward personal mobility over public and shared transportation due to the impacts of COVID-19. Because of this shift in consumer behavior the auto industry is reviving at a faster than expected rate. It is expected there will be an 8% rise in 2021 sales for the auto industry. The average cap rate compressed by 39bps from Q4 to Q1 while the average lease term has remained at 9 years. A flight to quality locations resulted in about half as many Q1 transactions compared to Q4.
QTR | SALE PRICE | LEASE TERM REMAINING | BUILDING SF | RENT SF/YR | PRICE SF | CAP RATE |
|---|---|---|---|---|---|---|
Q2-2020 | $2,016,269 | 10 Years | 6,603 | $20 | $335 | 6.66% |
Q3-2020 | $1,568,286 | 9 Years | 7,517 | $13 | $215 | 6.53% |
Q4-2020 | $1,567,433 | 9 Years | 7,701 | $13 | $209 | 6.20% |
Q1-2021 | $1,917,292 | 9 Years | 7,925 | $14 | $247 | 5.81% |
BANK
Despite banks being challenged with keeping their distribution channels open due to social distancing logistics and compliance functions that were never designed for remote work, the average cap rate for bank properties sold in Q1 compressed by 50 bps compared to Q4 while average lease term increased by just 3 years. Bank institutions that made strategic technology investments prior to COVID-19 came out stronger. Banks continue to be a focus for investors given the strong credit of the tenants.
QTR | SALE PRICE | LEASE TERM REMAINING | BUILDING SF | RENT SF/YR | PRICE SF | CAP RATE |
|---|---|---|---|---|---|---|
Q2-2020 | $3,128,660 | 9 Years | 5,438 | $40 | $809 | 5.53% |
Q3-2020 | $2,356,185 | 8 Years | 4,510 | $35 | $589 | 6.17% |
Q4-2020 | $2,946,412 | 8 Years | 6,868 | $35 | $657 | 5.91% |
Q1-2021 | $3,487,707 | 11 Years | 4,300 | $45 | $894 | 5.40% |
BIG BOX/SUPERSTORE
The big box sector within net lease continues to see diminished activity due to the pressure of online consumer spending and evolving square footage and business restructure. Cap rates for Q1 recorded at 6.45% while the average lease term dropped to 8 years from 10 years in Q4. While Q1 saw the number of big box trades increase to 6, from 2 in Q4, diminished activity is expected to continue through 2021 as owners are tasked with trying to resolve big box space use options. Since the pandemic, we haven’t seen a quarter with more than 10 trades in this asset type.
QTR | SALE PRICE | LEASE TERM REMAINING | BUILDING SF | RENT SF/YR | PRICE SF | CAP RATE |
|---|---|---|---|---|---|---|
Q2 | $9,220,250 | 13 Years | 164,513 | $3 | $55 | 6.37% |
Q3 | $15,051,400 | 11 Years | 128,093 | $9 | $133 | 6.60% |
Q4 | $10,200,000 | 10 Years | 120,000 | $4 | $85 | 4.91% |
Q1 | $8,562,597 | 8 Years | 122,508 | $5 | $71 | 6.46% |
CASUAL DINING
Casual dining net lease is one of the most impacted retail sectors affected by COVID-19 compliances as businesses struggle to stay afloat. The impact of COVID-19 has forever changed most restaurant business functions. As restrictions continue to be lifted, activity in casual dining will start to resume to a new business model normalcy. Casual dining companies that were able to adapt to a fast-casual dining model have been able to have the best success. Cap rates inflated by 32bps from 6.35% in Q4 to 6.67% in Q1.
QTR | SALE PRICE | LEASE TERM REMAINING | BUILDING SF | RENT SF/YR | PRICE SF | CAP RATE |
|---|---|---|---|---|---|---|
Q2 | $2,477,685 | 13 Years | 4,628 | $43 | $722 | 6.04% |
Q3 | $2,368,684 | 9 Years | 5,845 | $27 | $425 | 6.44% |
Q4 | $2,315,780 | 10 Years | 6,309 | $27 | $399 | 6.35% |
Q1 | $2,490,318 | 10 Years | 5,977 | $28 | $432 | 6.67% |
C-STORE / GAS
The C-Store/Gas station space remains to be a very active sector of net lease given the internet resistant foundation as well as being labeled as an essential business. Cap rates are holding steady with rates inflating just 5bps in 1Q. Revenue for C-Stores is expected to grow at an annual rate of 2% until 2026. As more people return to work and school, the need for C-Stores will increase. This sector is expected to see secure, positive activity through 2021.
QTR | SALE PRICE | LEASE TERM REMAINING | BUILDING SF | RENT SF/YR | PRICE SF | CAP RATE |
|---|---|---|---|---|---|---|
Q2 | $3,248,055 | 13 Years | 3,754 | $48 | $930 | 5.39% |
Q3 | $3,554,925 | 13 Years | 4,077 | $45 | $899 | 5.29% |
Q4 | $4,224,869 | 14 Years | 3,954 | $59 | $1,128 | 5.15% |
Q1 | $3,466,716 | 14 Years | 3,945 | $46 | $919 | 5.20% |
DOLLAR STORES
The Discount Dollar sector continues to be one of the most highly sought-after spaces as investors target growth opportunities given high volume of sale transactions being made in comparison to other retail sectors. Expect this sector to continue to outperform other sectors as flight to safety and recession resistance remains to be a target for investors. In Q1, cap rates held steady in the 7% range (6bps compression from Q4) as the average term, rent, and Price/SF remain relatively flat.
QTR | SALE PRICE | LEASE TERM REMAINING | BUILDING SF | RENT SF/YR | PRICE SF | CAP RATE |
|---|---|---|---|---|---|---|
Q2 | $1,433,274 | 12 Years | 9,251 | $11 | $157 | 7.11% |
Q3 | $1,398,275 | 11 Years | 9,275 | $10 | $151 | 7.00% |
Q4 | $1,337,228 | 11 Years | 9,160 | $11 | $151 | 7.03% |
Q1 | $1,381,912 | 10 Years | 9,719 | $10 | $148 | 6.97% |
EDUCATIONAL
The demand on the educational sector has been changing and evolving due to the impact of COVID-19. As schools continue to open their campuses to students, cap rates for educational NNN properties compressed by 51 bps in Q1 with average lease terms increasing to 14 years. While there has been a growing demand on homeschool companies due to stay at home orders, more net lease investors are seeking newly developed education space to perform higher yields as on-campus restrictions are lifted.
QTR | SALE PRICE | LEASE TERM REMAINING | BUILDING SF | RENT SF/YR | PRICE SF | CAP RATE |
|---|---|---|---|---|---|---|
Q2 | $3,629,030 | 8 Years | 9,523 | $23 | $347 | 6.58% |
Q3 | $3,494,222 | 9 Years | 9,889 | $25 | $353 | 7.14% |
Q4 | $2,558,173 | 10 Years | 8,595 | $21 | $296 | 7.33% |
Q1 | $4,076,387 | 14 Years | 11,106 | $25 | $370 | 6.82% |
FAST CASUAL
This sector consists largely of credit-worthy brands like Panera Bread and Chipotle. These brands and others in the industry alike have been able to quickly adapt to customer demand by space remodeling, adding drive-thru to permitted spaces and provide in-app and delivery orders. While supply dwindled (22 sales in Q4 compared to 8 in Q1), cap rates for this sector held steady through Q1. We expect to see more of the same in quarters moving forward as developers and investors seek sites suitable for and/or equipped with new drive-thru prototypes for these brands.
QTR | SALE PRICE | LEASE TERM REMAINING | BUILDING SF | RENT SF/YR | PRICE SF | CAP RATE |
|---|---|---|---|---|---|---|
Q2 | $2,794,091 | 9 Years | 4,100 | $39 | $683 | 5.70% |
Q3 | $2,254,258 | 12 Years | 2,960 | $45 | $806 | 5.99% |
Q4 | $2,506,494 | 15 Years | 3,594 | $41 | $764 | 5.39% |
Q1 | $2,402,444 | 14 Years | 3,898 | $36 | $654 | 5.39% |
GENERAL RETAIL
General retail sectors include fitness, hardware, furniture, home goods, cellular stores and other retail types which do not fall under one of the other focused sectors. Average cap rates have stayed historically consistent in the mid 6% range, and recorded at 6.65% in Q1. The number of properties trading hands in this sector increase back to historical averages, demonstrating how investors are again looking at the net lease retail sector in general as an attractive, low- or zero-management investment market with stable cash flow & sizable returns.
QTR | SALE PRICE | LEASE TERM REMAINING | BUILDING SF | RENT SF/YR | PRICE SF | CAP RATE |
|---|---|---|---|---|---|---|
Q2 | $2,129,364 | 6 Years | 8,784 | $25 | $390 | 6.94% |
Q3 | $2,363,848 | 8 Years | 5,895 | $34 | $512 | 6.52% |
Q4 | $2,601,242 | 8 Years | 4,392 | $34 | $615 | 5.62% |
Q1 | $1,996,018 | 8 Years | 7,257 | $16 | $368 | 6.65% |
GROCERY
Given the essential nature of the grocery sector that provides a safe and stable recession resistant asset, investors continue to look at this sector as stable cash flow. Average cap rates compressed by 56bps to 5.58% during Q1 due to increased consumer demand, as most grocery stores are comprised of strong, high credit tenants – Kroger, Albertsons, Sprouts, Aldi etc. Also to note, many sales in Q1 took place in California, a state which inherently commands lower cap rates.
QTR | SALE PRICE | LEASE TERM REMAINING | BUILDING SF | RENT SF/YR | PRICE SF | CAP RATE |
|---|---|---|---|---|---|---|
Q2 | $11,439,811 | 14 Years | 50,095 | $12 | $239 | 5.43% |
Q3 | $11,912,291 | 9 Years | 45,375 | $15 | $270 | 6.19% |
Q4 | $11,125,167 | 14 Years | 45,315 | $16 | $264 | 6.14% |
Q1 | $7,396,401 | 10 Years | 35,972 | $16 | $291 | 5.58% |
MEDICAL STNL
Given the medical industry has been deemed as one of the most important sectors due to the correlation impact of COVID-19, single tenant net leased medical properties saw a slight compression in average cap rates, recording at 6.78% in Q1. Through 2021, cap rates are expected to hold steady as most sales transactions in this sector are trading hands in suburban markets. As sales transactions grow into metropolitan markets, we can then expect to see a compression in cap rates.
QTR | SALE PRICE | LEASE TERM REMAINING | BUILDING SF | RENT SF/YR | PRICE SF | CAP RATE |
|---|---|---|---|---|---|---|
Q2 | $3,228,030 | 9 Years | 7,342 | $31 | $495 | 6.69% |
Q3 | $4,630,824 | 8 Years | 11,920 | $24 | $370 | 6.98% |
Q4 | $3,126,331 | 9 Years | 7,603 | $26 | $387 | 6.97% |
Q1 | $2,530,935 | 9 Years | 7,640 | $24 | $363 | 6.78% |
PHARMACY
Average cap rates for pharmacy net leased assets held steady in Q1 at 6.05%. As pharmacy stores are being looked at as another shopping alternative for consumers and pharmacists roles have changed given their accessibility to the public as health care professions, it is expected cap rates will remain relatively flat or slightly compressed through 2021. This sector is largely dominated by Walgreens transactions, and we expect to see the same over the coming months.
QTR | SALE PRICE | LEASE TERM REMAINING | BUILDING SF | RENT SF/YR | PRICE SF | CAP RATE |
|---|---|---|---|---|---|---|
Q2 | $5,835,871 | 13 Years | 13,534 | $27 | $431 | 6.30% |
Q3 | $5,048,283 | 12 Years | 13,516 | $23 | $375 | 6.28% |
Q4 | $4,943,355 | 13 Years | 13,556 | $21 | $370 | 6.06% |
Q1 | $5,089,840 | 10 Years | 13,919 | $21 | $367 | 6.05% |
QSR
QSR remains a steady and highly sought-after asset type given the sector’s minimal need for COVID-19 adaption compared to other food service providers. Further, QSRs typically offer a lower price point and a higher percentage of absolute NNN lease types for investors compared to other sectors. Cap rates in Q1 compressed 3bps compared to Q4. It is expected the QSR sector cap rates will remain relatively flat or slightly compressed through the first half of 2021.
QTR | SALE PRICE | LEASE TERM REMAINING | BUILDING SF | RENT SF/YR | PRICE SF | CAP RATE |
|---|---|---|---|---|---|---|
Q2 | $1,984,832 | 13 Years | 2,721 | $46 | $837 | 5.64% |
Q3 | $2,016,638 | 13 Years | 2,796 | $44 | $824 | 5.62% |
Q4 | $2,011,874 | 15 Years | 2,847 | $42 | $770 | 5.60% |
Q1 | $2,131,259 | 13 Years | 2,837 | $44 | $820 | 5.57% |
YTD Market Sales Data – By Region
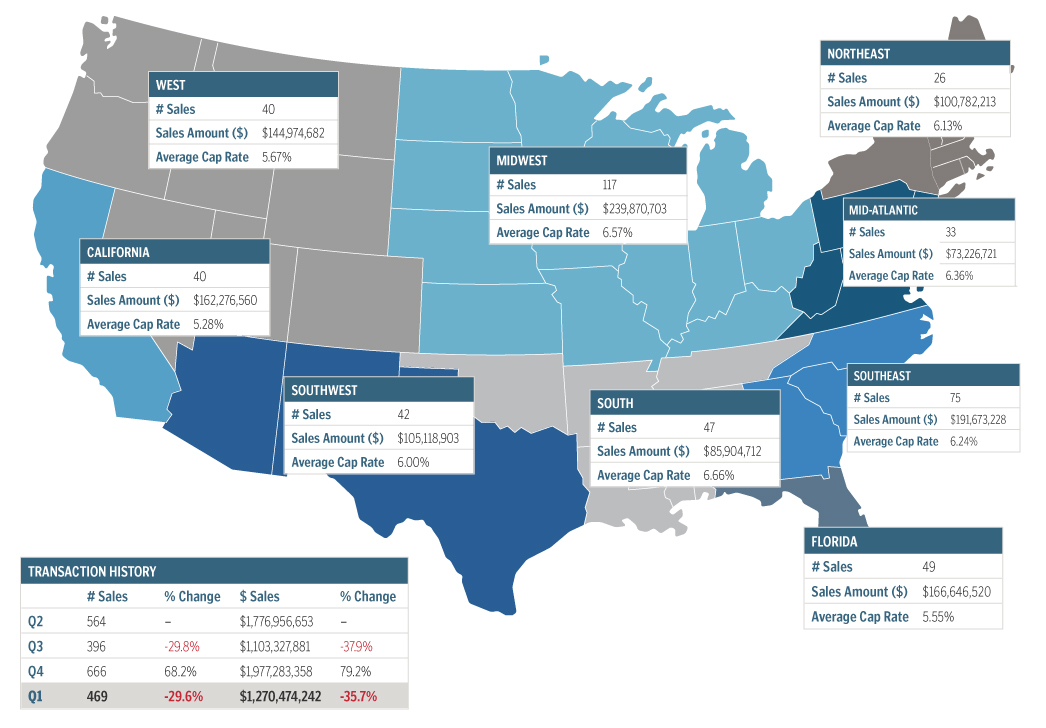
* Market totals represent the study’s sample sizes for select industries and are not indicative of all retail sales that occurred for all of 2020. Analysis has accounted for sales as reported to sources deemed reliable in the following sectors: Automotive, Bank, Casual Dining, C-Store, Dollar Stores, QSR, Medical, Pharmacy, Childcare, Fast Casual, Grocery, Big Box, and General Retail (Fitness, Hardware, Furniture, Cellular Stores, etc.). This may exclude confidential and/or proprietary information.
For more information
-
Matthew Mousavi
Sr Managing Principal & Co-Head of National Net Lease
949.698.1116
[email protected]