Average Summary Report – Cap Rates by Industry Sector
For this report, SRS reviewed Q2/2022 sales reported by Costar for the following sectors: Automotive, Bank, Big Box/Superstore, Casual Dining, C-Store/Gas, Dollar Stores, Educational (Childcare), Fast Casual, Grocery, General Retail, Medical STNL, Pharmacy, and QSR. In Q2 it’s especially important to understand the impact the pandemic, rising inflation rates, Federal Reserve decision-making, and other market conditions have had on the relationship between length of lease term and capitalization rates across all product types as well as the effect on buyer bias toward certain sectors. Despite growing inflation and recent hikes in US Treasuries in 2022, NNN retail across virtually all asset types saw a compression in cap rates. Specifically, 1031 Buyers have largely sought out quality product, settling for lower cap rates while taking advantage of historically low interest rates to garner attractive leveraged returns. Many sectors have seemingly been unaffected by inflation and rate hikes to date, although many of the transactions through Q2/2022 were the remnants of 1031 buyers who had entered an exchange and/or escrow prior to any pricing correction needing to be made. The necessity of locking in mortgage interest rates has been emphasized by SRS NNLG’s real estate professionals, and we rely heavily on our Debt & Equity team to obtain the most attractive financing structures available.
Some recent comments from SRS’ Debt & Equity Team
The Fed increased rates by another 75 basis points last month. However, in recent weeks we have seen U.S. Treasury yields fall after a few key reports signaled that high inflation may be cooling off. The 10-year Treasury is now hovering around [2.89%] down from a high of over 3.00%. This dip came after the manufacturing report for July showed an a sharper-than-expected decline in prices paid. This measure can be seen as a sign that inflation could decline in the coming months. With that said, the Fed Funds rate remains high which means lenders have an extremely wide range of rates. Anywhere from the 4% range all the way up to the 6% range. The SRS Debt & Equity division is consistently beating out the majority of relationship-banks in this volatile market.
– Matt Marlin and Ben Townsend | SRS Debt & Equity
Note: this report captures data only for transactions which have reported a sale price and capitalization rate. The following data has been collected from sources deemed reliable; it may not include confidential and/or proprietary information of the marketplace.
AUTOMOTIVE
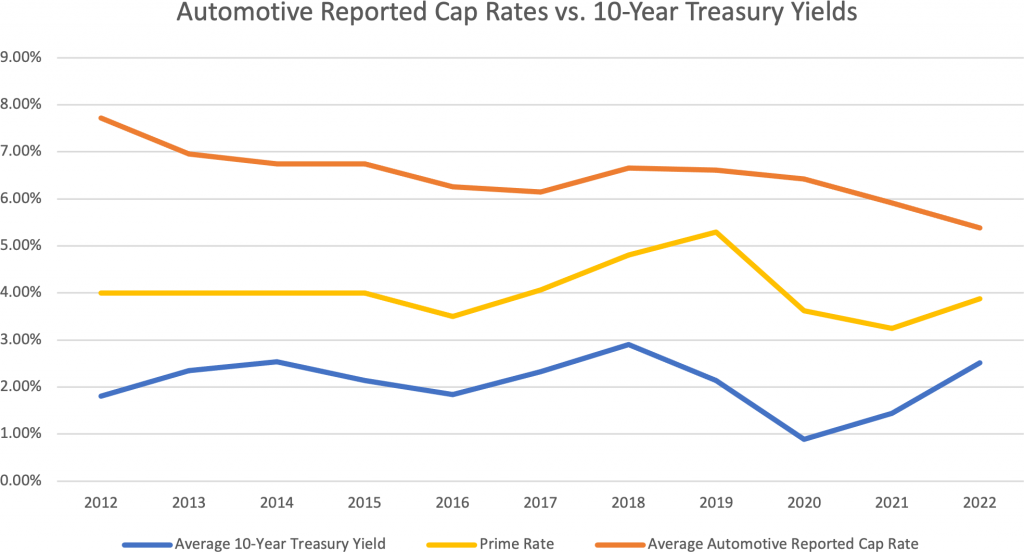
The Automotive sector of this sector is comprised of O’Reilly Auto Parts, AutoZone, and Advance Auto Parts. Q2 saw a large compression of cap rates over Q1, largely due to a flight to higher quality markets – nearly 40% of the sales in Q2 were in FL or the West Coast, compared to 25% in Q1. Mixed with a longer average term remaining, average cap rate compressed 68 bps to 5.02%. As with the rest of retail market, Automotive cap rates have steadily declined over the last 10 years, with relatively delayed and minimal reaction to fluctuating Prime Rates and 10-Year Treasury Yields.
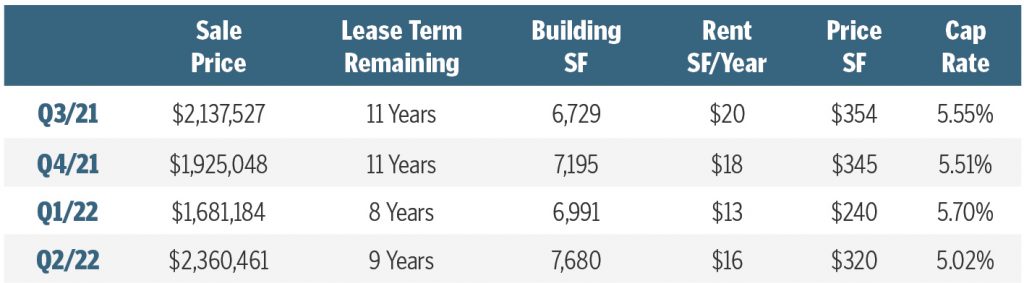
Cap Rate Data includes Advance Auto Parts, O’Reilly Auto Parts, and AutoZone per CoStar.
BANKS
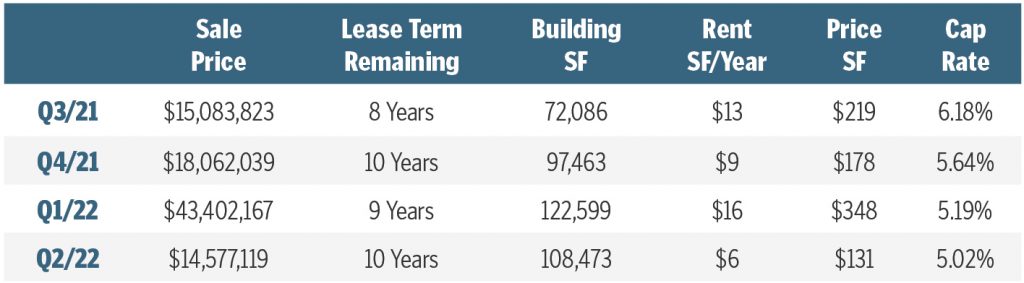
Banks have always been seen as a safe investment and a steady source of income for investors. There has been little change in cap rates over the last 1-2 years in this sector, as the flight to quality, high credit tenants remains a large part of the NNN retail CRE market. This analysis saw a stagnant cap rate compared to Q1, as can be expected with this asset type. In fact, average cap rates for bank assets has had the lowest amount of fluctuation of all asset types in this study over a trailing 10-year study. Even with online/e-banking becoming more prevalent in today’s world, investors can likely expect more of the same in terms of cap rates in the short term.

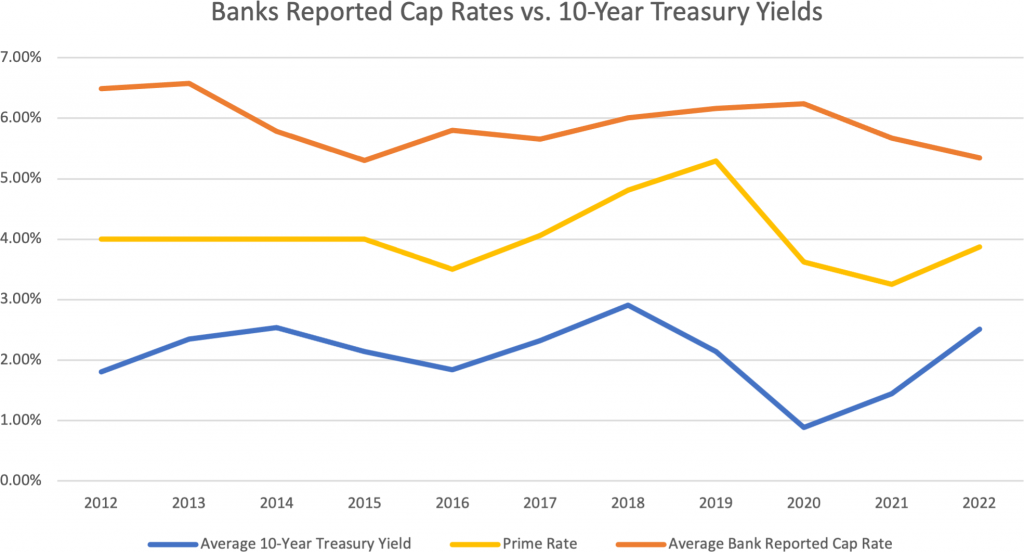
Cap Rate Data includes all brands categorized as “Bank” per Costar.
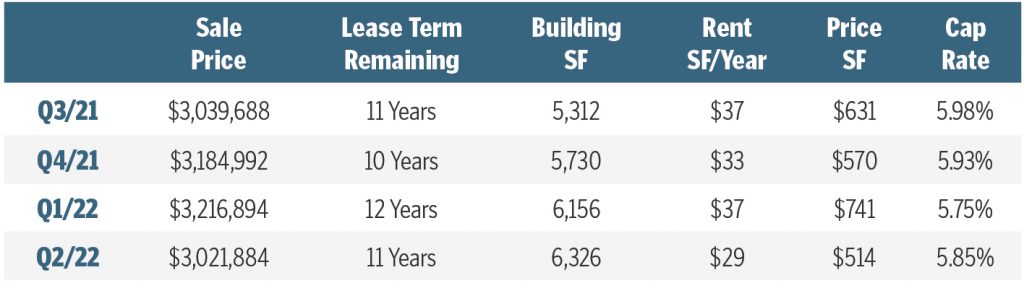
BIG BOX/SUPERSTORE
The Single Tenant Big Box/Superstore sector has not often been one of extreme volume–since the start of Covid, we’ve only seen 1 quarter with more than 10 Big Box/Superstore trades. Q2 of 2022 is more of the same, with just 3 assets trading. Cap rates have been steadily trending downward over the last year. With recent news regarding the Prime Rate, Inflation trending down in July, and supply chain issues inhibiting abilities of large distribution players like Amazon, Big Box/Superstore assets continue to be a hot topic among investors seeking Tier A Credit tenants paying high 6- to 7-figure rents, whilst staying cognizant of potentially needing to replace 100k+ SF of retail space.
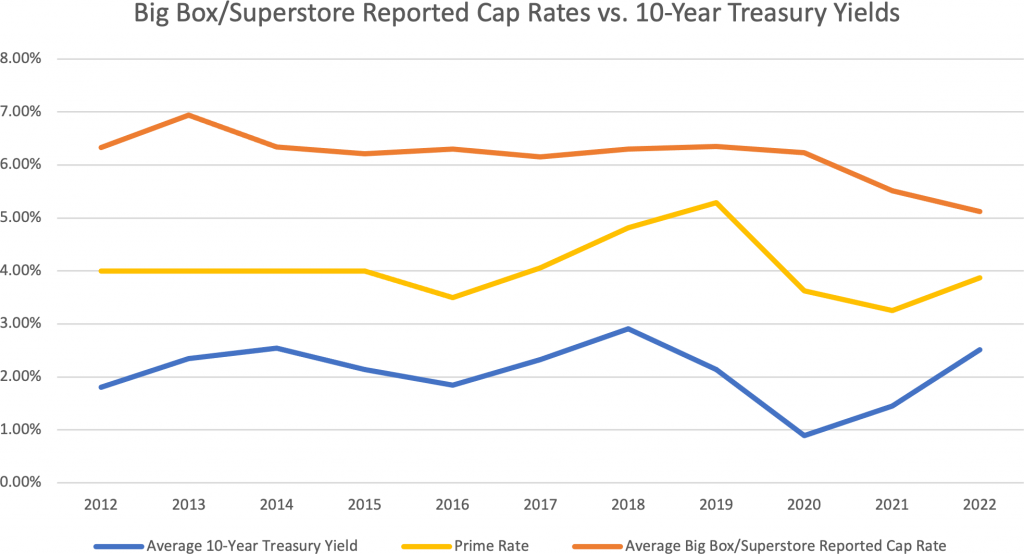
Cap Rate Data includes Walmart, Costco, Target, BJ’s, Sam’s Club, Home Depot, and Lowe’s Home Improvement per CoStar.
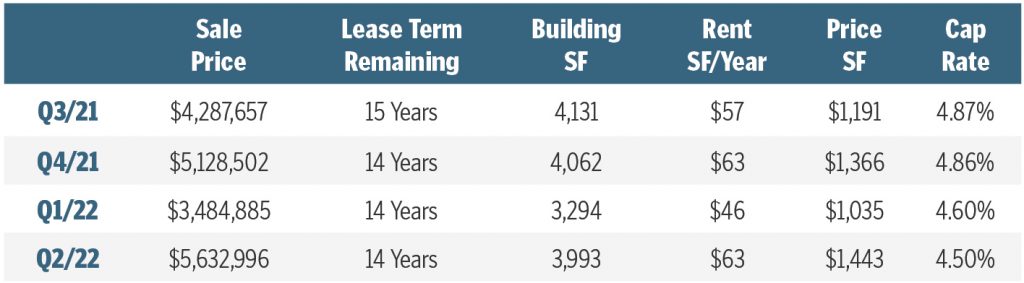
CASUAL DINING
It may be time to say Casual Dining has officially bounced back after taking arguably the largest hit as a result of the pandemic. The sector has steadily increased transaction volume, with Q2 surpassing 100 assets sold–a 20% jump over Q1. A slight compression of 10 bps can be expected with relatively similar price points and less term remaining. Casual Dining assets almost always feature scheduled annual rental increases or increases every 5 years (some of which might be tied to CPI) which is attractive to investors in light of high inflation rates over the last 8-12 months. Expect investors to flock to leases with potential and/or scheduled income growth moving forward.
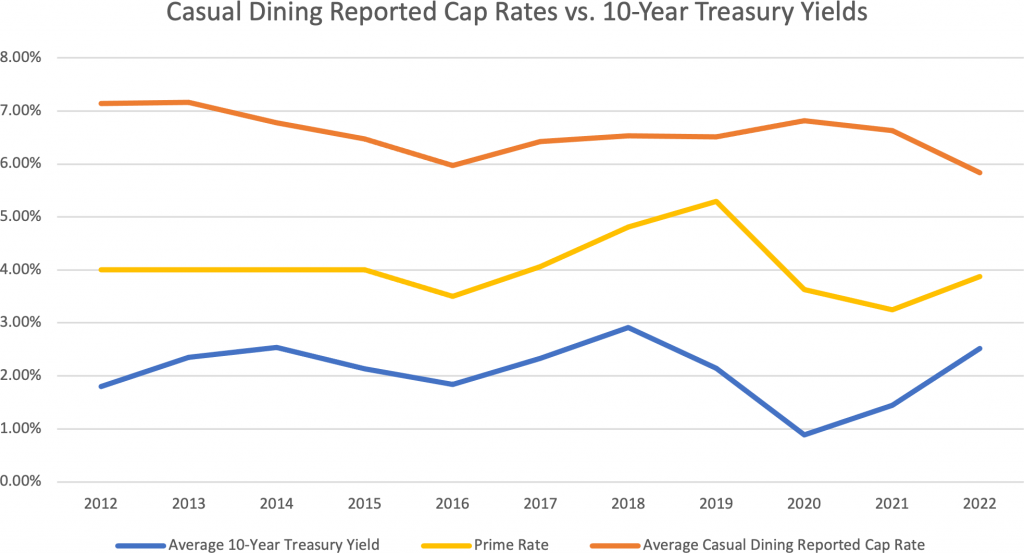
Cap Rate Data includes Red Lobster, Applebee’s, and IHOP per Costar.
C-STORE
C-Stores continue to be highly sought after investments for a number of reasons: (1) almost all nationally recognized C-Stores carry corporate guaranteed leases; (2) leases feature rental increases; and (3) Accelerated Depreciation. C-Store/Gas Station assets have the ability for the exceptional tax benefit of Accelerated Depreciation – allowing investors to depreciate up to 100% of the newly acquired asset within the first year of ownership. *Expect C-Stores to continue experiencing cap rate compression, or stay relatively flat over months to come. *We are not tax professionals – consult your tax advisor for more details.
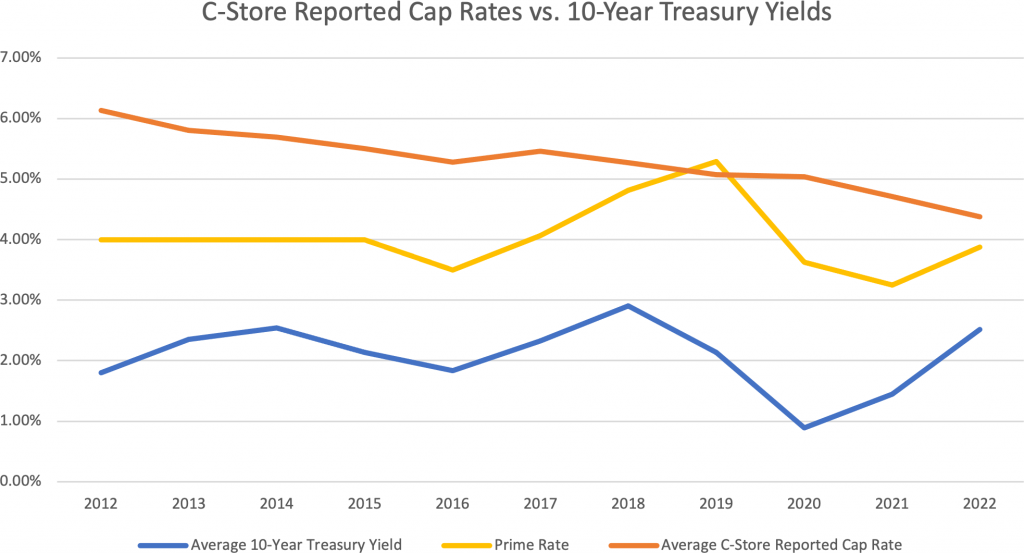
Cap Rate Data includes 7-Eleven and Wawa per CoStar.
DOLLAR STORE
Dollar Stores have been a hot commodity since the beginning of the pandemic due to their corporate guarantees, absolute NNN lease nature, and rapid expansion plans for the major brands in the sector (Family Dollar, Dollar General, and Dollar Tree). Within the last 10 years, Dollar General transitioned to an Absolute NNN lease in nature and a 15-year base lease term, contributing to significantly increased demand across the country. Cap Rates have compressed over 220 bps from 2012, and have had virtually no historical correlation to the Prime Rate or the 10-Year Treasury Yield.

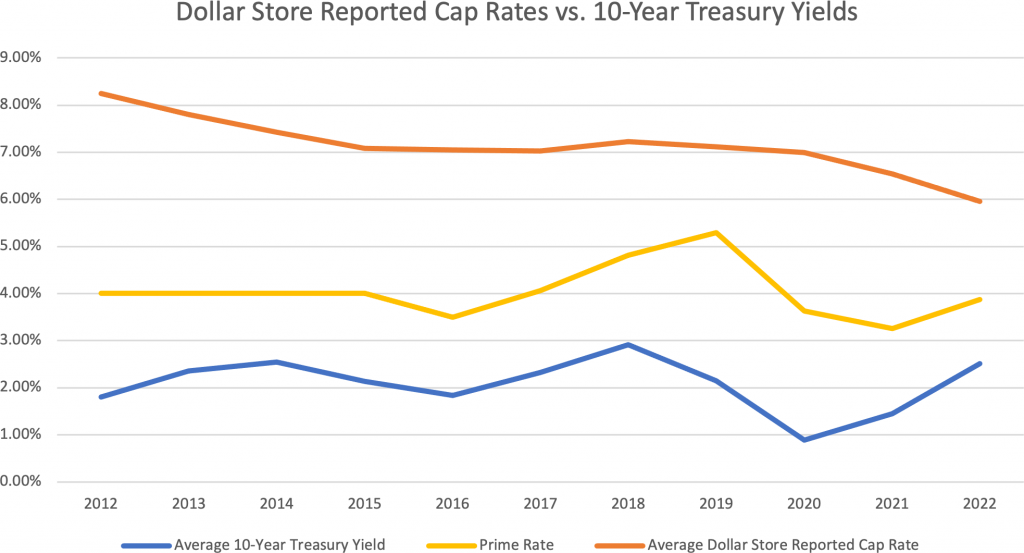
Cap Rate Data includes Dollar General and Family Dollar per Costar.
EDUCATION/CHILDCARE
Childcare has been a largely fluctuating sector since the start of the pandemic, as cap rates for this sector are more heavily dependent on surrounding real estate fundamentals for each site. Investors in this sector often seek out family/neighborhood-oriented new development sites taking advantage of under-served communities, leading to a steep drop in cap rates over the last 2 quarters. NNN Leases in this sector are relatively new as well, allowing cap rates over the last 10 years to see a steep drop with minimal correlation to adjustments in Prime Rates and Treasury Yields.
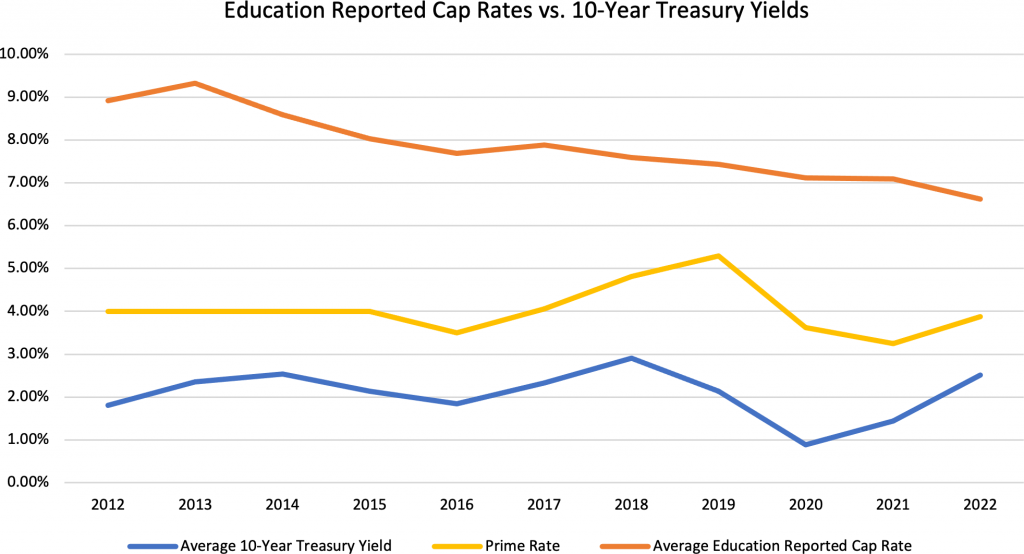
Cap Rate Data includes all sales categorized as “Day Care Center” per Costar.
FAST CASUAL
This sector is comprised of mainly high-credit tenants such as Panera Bread and Chipotle. As such, cap rates continue to trend in the high 4 – low 5 range. The mass-incorporation of Drive-Thru Lanes for those two tenants demonstrate their commitment to contactless, fast service, and have put their credit-worthiness and investor demand in line with the QSR sector. During Q2, there was a drop in transactions by about 50%–the result of investors who have decided to hold these high-credit, NNN leases, as well as developers running into issues with build-out processes in light of high inflation and development costs.
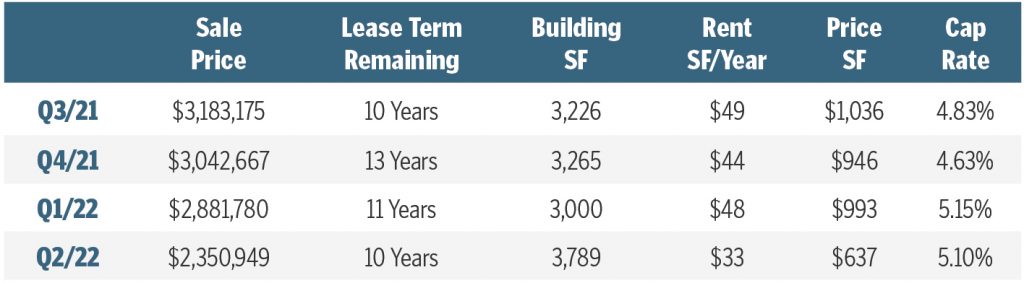
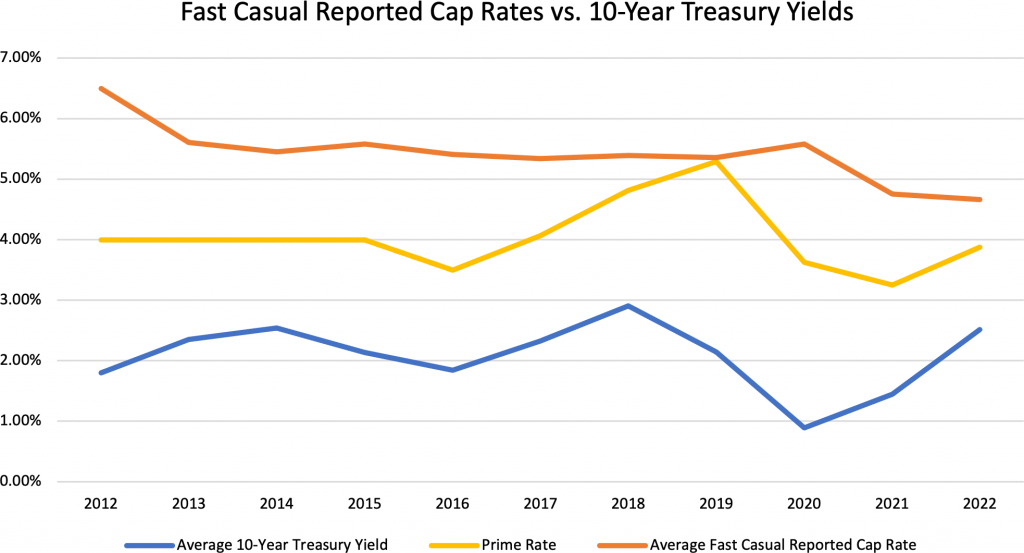
Cap Rate Data includes Chipotle, Panera Bread, PDQ, Pollo Tropical, and McAlister’s Deli per CoStar.
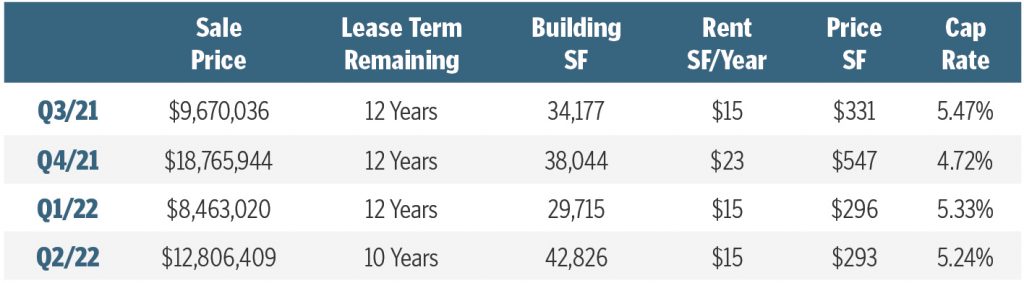
GENERAL RETAIL
This sector is comprised of other Retail concepts such as cell stores, furniture, fitness, etc., not covered in the other sectors of this report. Savvy investors continue to seek out high-quality locations, leading to an expected compression in cap rates in Q2. It will be interesting how investors view these assets moving forward in light of recent concerns over inflation and rising rates.

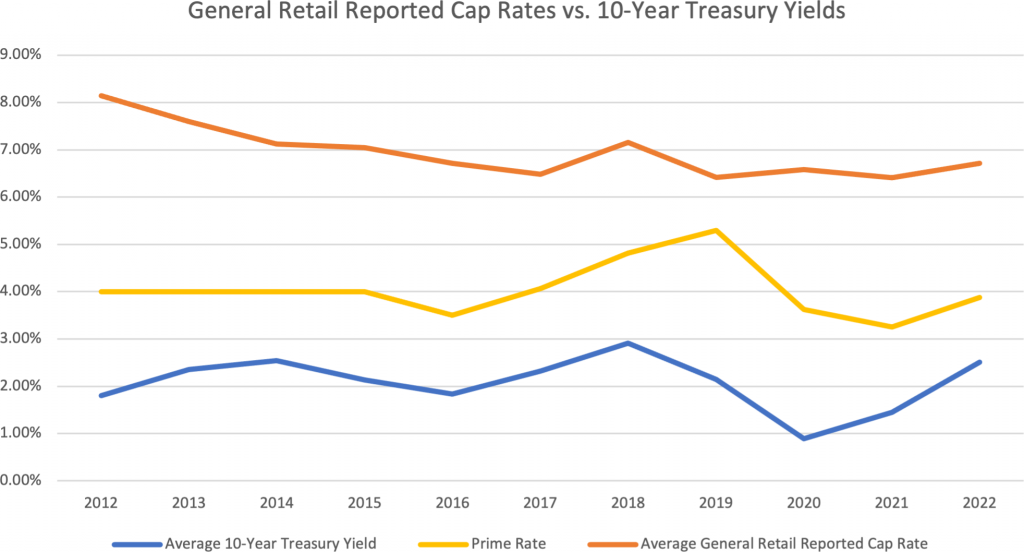
Cap Rate Data includes Verizon, Sherwin-Williams, Mattress Firm, Planet Fitness, and LA Fitness per Costar.
GROCERY
Grocery stores are a coveted asset to investors as they are classified as essential business and are one of the most e-commerce resistant asset classes in the market. As such, cap rates have continued to hold in the high 4 to low 5 range, and there continues to be robust volume in terms of transactions – 18 in Q1 and 23 in Q2. Q2 saw more trades of assets in superior markets, as demonstrated by a compression of cap rate despite 2 years of lower average term remaining in comparison to Q1. It will be interesting to see how investors react to recent inflation reports and Federal Reserve decision-making in the months ahead, especially considering a number of grocery tenant leases feature flat rent schedules.
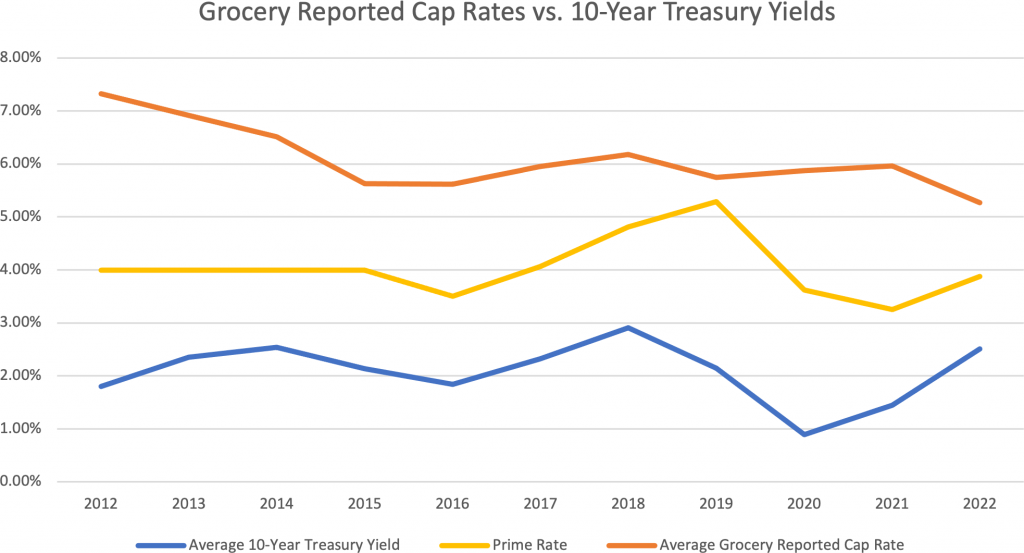
Cap Rate Data includes all sales categorized as “Supermarket” per Costar.
MEDICAL
Medical/Healthcare properties are attractive investments due to their economic and e-commerce resistance. The sector saw a significant compression in cap rates throughout the pandemic, most notably dipping from an average of 6.78% in Q1 2021 to 5.89% in Q1 2022. The sector has seen a steady amount of transaction volume and demand of late, with approximately 25 transactions between dialysis, urgent care, and emergency centers in each of the last two quarters. Cap Rates compressed by about 15 bps while average lease term remaining remained the same, largely attributed to a smaller amount of nationally branded assets trading in Q2 (DaVita and Fresenius).

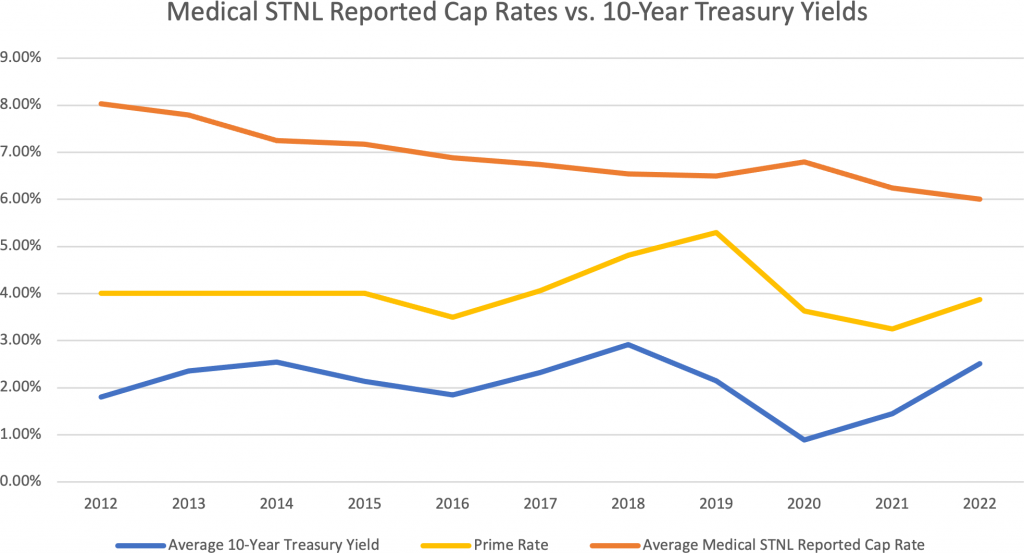
Cap Rate Data includes DaVita and Fresenius per Costar.
PHARMACY
Pharmacy continues to be strong asset type with attractive corporate guaranteed leases. Many owners may seek to offload older, existing leases which may have been originally negotiated with flat rent schedules. On the contrary, owners of assets with scheduled rental increases have seen increased demand as a result of inflation rates. Regardless, the investment grade credit of tenants such as Walgreens in this space offer a reliable, steady income stream for investors within the $2-8M+ price range. Assets recently trading have been largely in strong, primary markets, as evidenced by a compression in cap rate despite lower average term remaining.
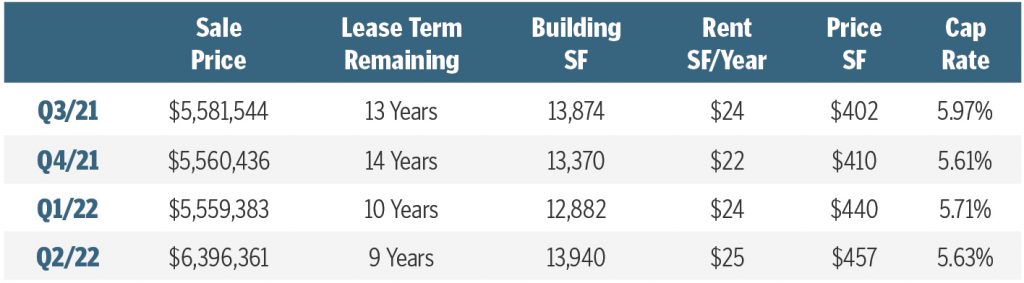
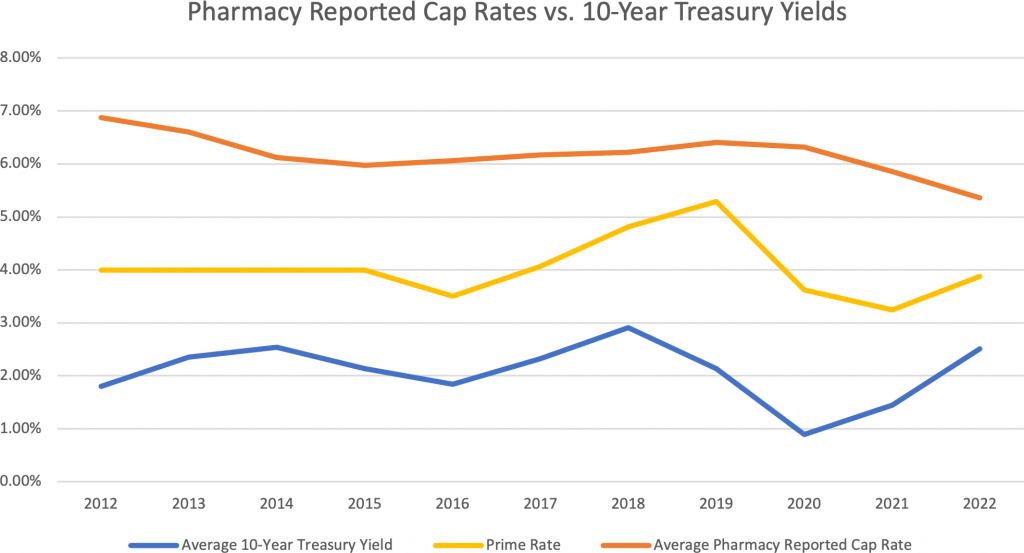
Cap Rate Data includes CVS and Walgreens per Costar.
QSR
It can be argued QSR is the pinnacle of the Single Tenant Net Lease retail space. This sector continues to see robust transaction volume for newly constructed buildings and strong credit corporate or franchisee backed leases. Tenants such as Raising Cane’s, Chick-fil-A, Sonic, Popeyes, and more continue their development efforts, contributing to the longest average term remaining across all sectors in this study. Further, rental increases, attractive real estate fundamentals, and essential business classification of these assets drive the consistently-lowest average cap rate across all sectors of the market. QSR assets will be an interesting sector to observe in the times ahead.

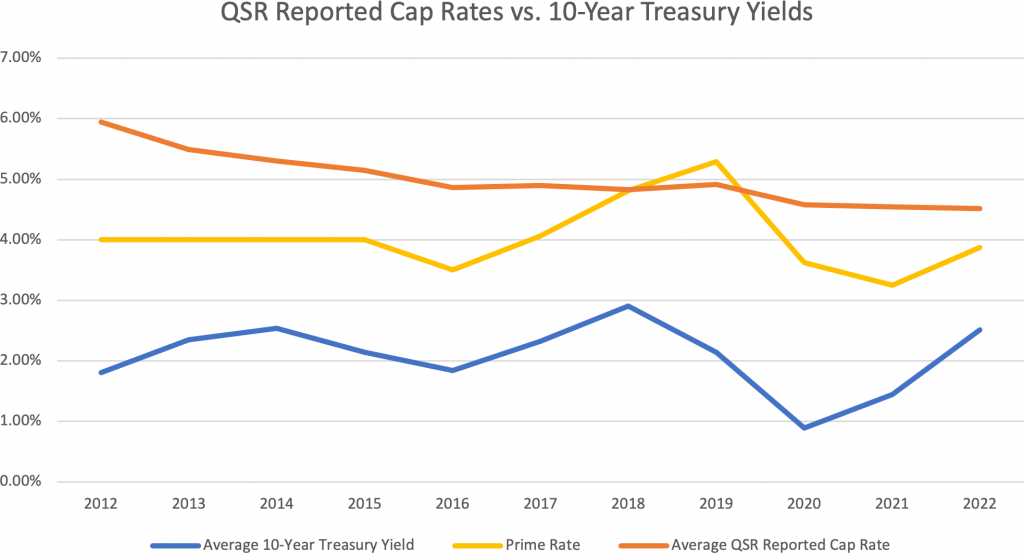
Cap Rate Data includes Chick-fil-A, McDonald’s, and Starbucks per Costar.
Q2/2022 Market Sales Data – By Region
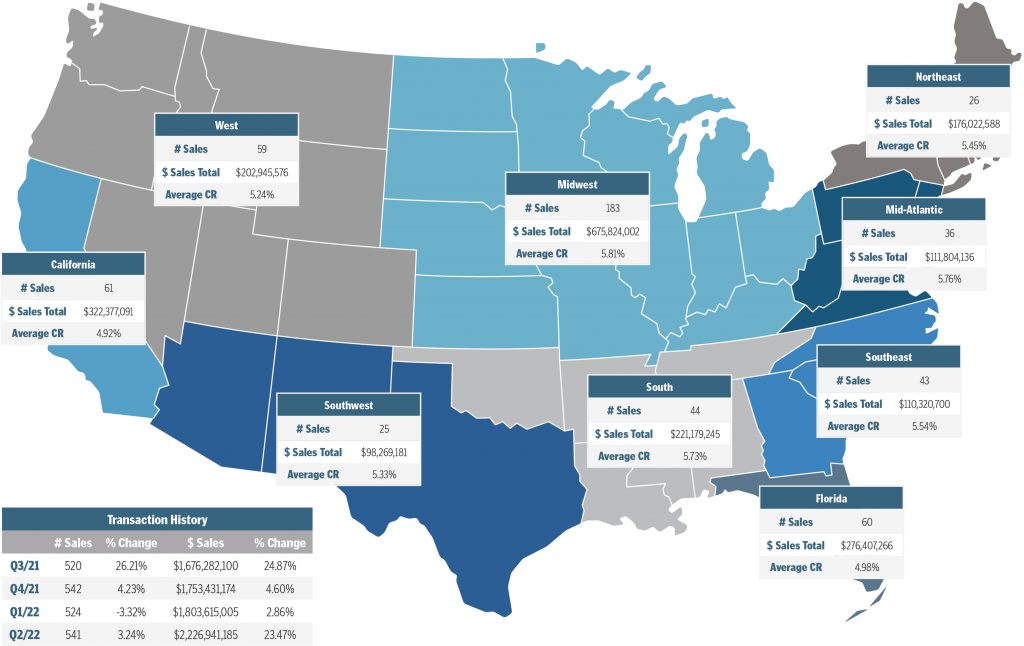
*Market totals represent the study’s sample sizes for select industries and are not indicative of all retail sales which may have occurred during applicable time frames. Analysis has accounted for sales as reported to sources deemed reliable in the following sectors: Automotive, Bank, Casual Dining, C-Store, Dollar Stores, QSR, Medical, Pharmacy, Childcare, Fast Casual, Grocery, Big Box, and General Retail (Fitness, Hardware, Furniture, Cellular Stores, etc.). This may exclude confidential and/or proprietary information.

Managing Principal, National Net Lease Group & Investment Properties Group
949.698.1116

Managing Principal, National Net Lease Group & Investment Properties Group
949.698.1116

Executive Vice President, National Net Lease Group & Market Leader
954.302.7365