Market Trends Review & Forecast
In Q4, we saw the first palpable effect from the extreme inflation the US reported in October. Consumer sentiment in November fell to its lowest level since 2011, measuring 66.8. Holiday spending helped sentiment rebound up to 70.6, though still a much lower figure than pre-pandemic studies. Consumer views on both present and future economic expectations continue to downgrade from the pressures caused by inflation and the lack of available goods caused by global supply chain issues. Inflation closed out the year at 6.8%, the highest seen since 1982. As the pressures from the Omicron variant persists, more consumers are purchasing goods rather than services. The increase purchases in goods will likely compound inflation as demand remains high and supply chain challenges continue. The latest wave of Covid is also likely to prompt an economic slowdown as some restaurants and retails have had to shut locations or reduce hours as they cope with staff and inventory shortages.

As consumers focus their spending on goods, US retail and food services increase by 0.3% YOY November 2021. This breaks down to retail trade sales recording an increase of 16.1% YOY, while gasoline stations were up 52.3% and food and beverage services were up 37.4% YOY. Despite inflation levels, consumers have more disposal income from post pandemic savings and federal stimulus payments. Retail profit margins are expected to hit a high of 13% in 2021 as retailers are being challenged with an imbalance of demand and available inventory due supply chain issues. Retailers are continuing to adjust store square footages as some are being transformed into mini fulfillment centers for shoppers to pick up their orders and others are downsizing store footprints for cost efficiently.
2021 Key Indicators
QSR Digital Transformation
- Quicker Service
- Brand Sustainability
- Digital Kitchens
- Tech-Driven Ordering and Curbside Pickup
Grocery Stores
- Digital Orders 15% (10% in 2021)
- Smoothie Making Machines & Salad Robots
- Omnichannel Store Prototypes
- New Contactless Payment Services
Evolving Customer Behavior
- Live Streaming Shopping/Social Commerce
- Ecommerce Sites & Contactless Payment
New Amazon Platforms
- Amazon 4 Star
- Amazon Fresh
- Amazon Pop-Up
- Amazon Go/Go Grocery
2021 Economic Review & Forecast
COVID-19 Vaccination | 203.8 million (61%) people in the U.S. are fully vaccinated in Dec/2021
Startups are Growing | 432,000 new business applications in Nov/2021 (up 9% YOY)
Evolving Work Force Environment | Remote Work & Space Hybrid Conversions
Liquid Deposits | Increased by 4.8% since Nov/2020
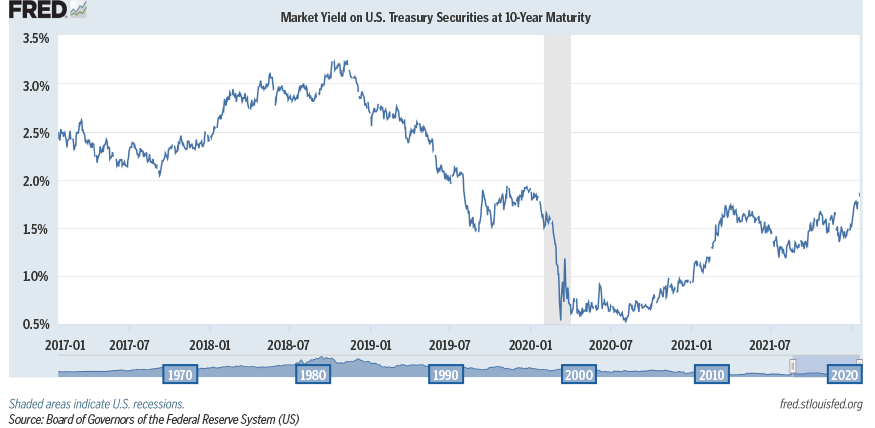
10-Year Treasury Note | Expected to rise to 2.1% in 2022, up from the current rate of 1.52%. This increase could create challenges for buyers to obtain ideal financing.
Year-End Inflation | Closed at 6.8% – highest in nearly 40 years & forecasted to average 7% in 1Q/22
GDP | Expected to grow 4.0% in 2022, down from 6.9% growth in 2021
Source: Kiplinger Forecast & Reuters
The 10-Year Treasury continues to climb as the Fed announced they expect to increase interest rates at least four times in 2022 as yields increase due to the pressure of growing inflation. The 10-Year Treasury rate is expected to rise to at least 2.1% by mid-year with the current rate recording at 1.9%.
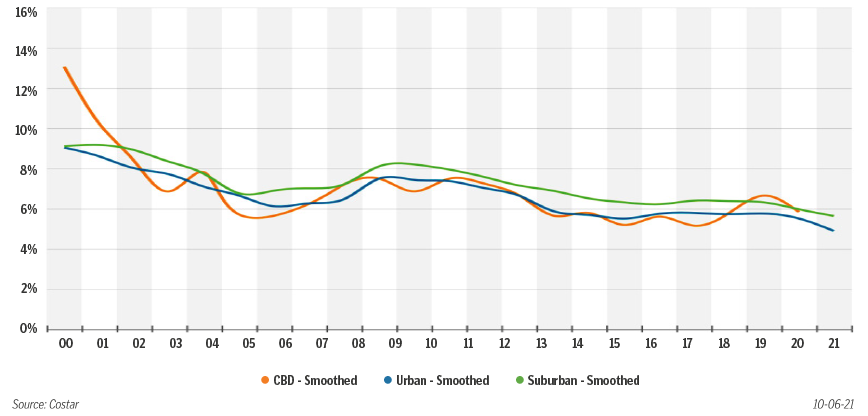
National NNN Retail Cap Rates by Location Type
Average Summary Report – Cap Rates by Industry Sector
For this report, SRS reviewed Q4 2021 sales reported by Costar for the following sectors: Automotive, Bank, Big Box/Superstore, Casual Dining, C-Store/Gas, Dollar Stores, Educational (Childcare), Fast Casual, Grocery, General Retail, Medical STNL, Pharmacy, and QSR. In Q4 it’s especially important to understand the impact the ongoing pandemic and overall market conditions have had on the relationship between length of lease term and capitalization rates across all product types as well as the effect on buyer bias toward certain sectors. With growing inflation and expected hikes in US Treasuries in 2022, NNN retail across virtually all asset types saw a compression in cap rates. Specifically, 1031 Buyers have largely sought out quality product, settling for lower cap rates while taking advantage of historically low interest rates to garner attractive leveraged returns.
Note: this report captures data only for transactions which have reported a sale price and capitalization rate. The following data has been collected from sources deemed reliable; it may not include confidential and/or proprietary information of the marketplace.
AUTOMOTIVE
Due to the delay issues with supply chain operations and chip shortages, the automotive industry has been directly impacted as available inventory has become very limited. Despite the lack of inventory, consumer demand has remained strong. Consumers are pivoting to digital purchases, electronic and used car sales. In 2021, auto manufactures sold 15 million new vehicles, which is 2.5% more compared to 2020. The average cap rate remained flat decreasing by just 3 bps from Q3 while the average lease remained at 11 years in Q4.

BANK
The impact of the pandemic forced the banking industry to dive into new digital banking transformation as bank branches continue to pivot to new business models. The industry has shown resilience by successful technology improvements that benefit both bank businesses and clients. The average cap rate for bank properties sold in Q4 decreased by 42 bps compared to Q3 while average lease term decreased by 1 year. Banks continue to be in high demand for investors given the strong credit of the tenants.

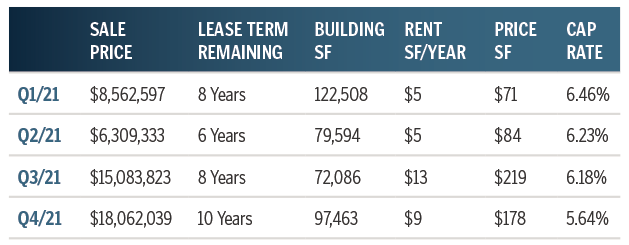
BIG BOX/SUPERSTORE
The big box sector within net lease continues to see diminished activity due to the pressure of online consumer spending, evolving smaller square footage footprints and business restructure. Cap rates for Q4 recorded at 5.64% while the average lease term increased to 10 years from 8 years in Q3. In Q4, an investment sale to note was Home Depot located in Anaheim, CA, which is the largest Home Depot location on the West Coast, traded at $53 million ($259 PSF). Since the pandemic, we have not seen a quarter with more than 10 trades in this asset type.
CASUAL DINING
The impact of pandemic has forever changed most restaurant business functions, especially the casual dining sector. Casual dining restaurants have pivoted to a new business model normalcy. Casual dining companies that were able to adapt to a fast-casual dining models have had the best success. Cap rates continue to compress in this sector with the average cap rate falling 5bps from 5.98% in Q3 to 5.93% in Q4. Pricing and overall investment demand for casual dining has increased as investors have seen the success of the changes in this industry.

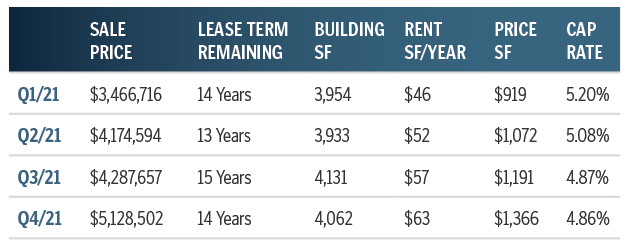
C-STORE / GAS
The c-store/gas station space remains to be a very active sector of net lease given the internet resistant foundation as well as being labeled as an essential business. Performance of c-store/gas stations will likely depend heavily on gasoline prices and sales. Over the past twelve months, gasoline prices have increased by 49.6%. Total vehicle miles are expected to increase as forecasted gasoline prices are expected to stabilize. Revenue for C-Stores is expected to grow at an annual rate of 1.5% until 2026. Cap rates stayed flat recording down by just 1 bps in 4Q to 4.86% while average price per square foot increased by 14.6%.
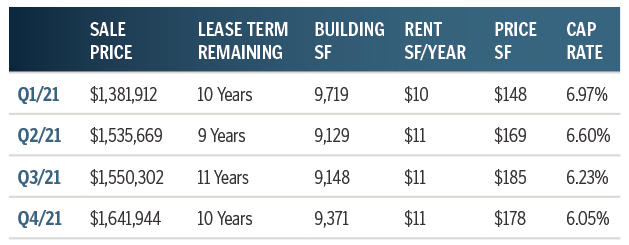
DOLLAR STORES
The discount dollar sector continues to be one of the most highly sought-after spaces as investors target growth opportunities. Expect this sector to continue to outperform other sectors as flight to safety and economic resistance remains to be a target for investors. In Q4, cap rates compressed 18 bps to 6.05% while average term, rent, and price/sf remain relatively flat. While there are hundreds of these sites on market, there has been a noticeable decline in the percentage of available discount/dollar assets featuring long lease terms and absolute NNN lease structures. Due to the attractiveness of assets with these attributes, many of them are being traded before coming to market, closing with cap rates in the low- to mid-5% range.
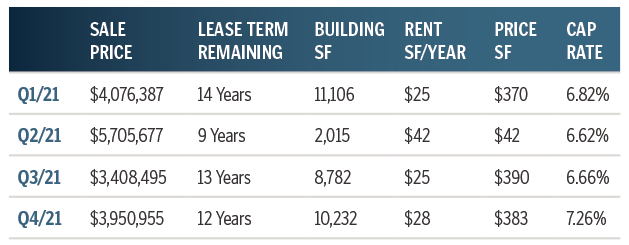
EDUCATIONAL/childcare
The demand on the educational sector has been changing and evolving due to the continued effects of the pandemic. As schools continue to open and/or close their campuses to students, cap rates for educational/childcare NNN properties increased into the 7% range at 7.26% in Q4 with average lease terms recording at 12 years. While there has been a growing demand on homeschool companies, more net lease investors are seeking newly developed education space to perform higher yields as on-campus restrictions fluctuate.
FAST CASUAL
This sector consists largely of credit-worthy brands like Panera Bread and Chipotle. These brands and others in the industry alike have been able to quickly adapt to customer demand by space remodeling, adding drive-thru to permitted spaces and provide in-app and delivery orders. While sales volume decreased from last quarter (16 in Q3 compared to 9 sales in Q4), cap rates for this sector decreased 10 bps to 4.63%. We expect to see more of the same in quarters moving forward as developers and investors seek sites suitable for and/or equipped with new drive-thru prototypes for these brands.

GENERAL RETAIL
General retail sectors include fitness, hardware, furniture, home goods, cellular stores and other retail types which do not fall under one of the other focused sectors. Average cap rates have stayed historically consistent in the mid 6% range while recording at 6.34% in Q4. The number of properties trading hands in this sector increase back to historical averages and have held steady, demonstrating how investors are again looking at the net lease retail sector in general as an attractive, low or zero-management investment market with stable cash flow and sizable returns.

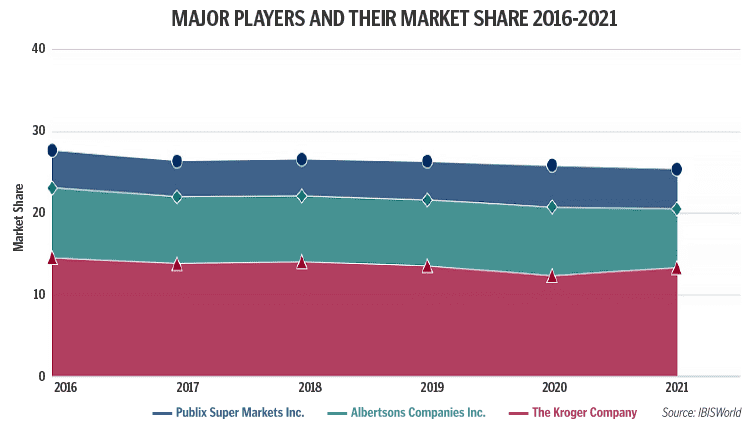
GROCERY
Given the essential nature of the grocery sector that provides a safe and stable recession resistant asset, investors continue to look at this sector as stable cash flow. Average cap rates fell into the 4% range recording at 4.72% during Q4 due to increased flight to higher priced markets, as most grocery stores are comprised of strong, high credit tenants – Whole Foods, Kroger, Albertsons, Sprouts, Amazon Fresh, etc. This sector is expected to see secure activity into 2022, as brands make continued efforts to combat recent supply chain issues.

MEDICAL STNL
Given the medical industry has been deemed as one of the most important sectors due to the correlation impact of the pandemic, single tenant net leased medical properties average cap rates experienced a sharp compression of 54 bps, down to 5.91% in Q4. Moreover, Q4 saw the most NNN Medical or “Medtail” transactions of any other quarter in 2021. As more investors see urgent cares, dialysis centers, and emergency care centers as sources of stable cash flows, we can expect cap rates to hold steady or compress further in 2022, so long as lender financing remains available.

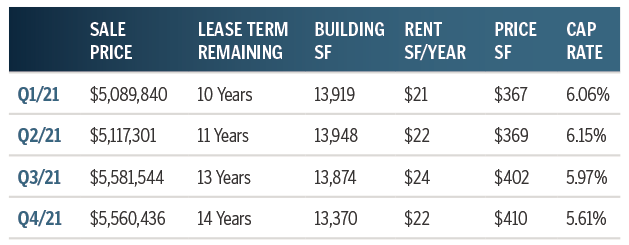
PHARMACY
Pharmacy continues to be a strong asset class for 1031 investors seeking investment grade credit tenants. The average cap rate for these assets compressed to 5.61% in Q4. The sector is largely dominated by Walgreens transactions. CVS assets have seen an increase in trades as investors seek out to both purchase and sell quality sites in the wake of the brand announcing they will be closing 900 stores, starting in the Spring 2022. Still, quality assets within this sector will continue to be sought after by the majority of investors moving forward. We expect to see a large influx of “dark” or subleased CVS assets hit the market throughout the year ahead.
QSR
QSR remains a steady and highly sought-after asset type given the sector’s minimal need for adaption compared to other food service providers. Further, QSRs typically offer a lower price point and a higher percentage of absolute NNN lease types for investors compared to other sectors. Cap rates continue to compressed, falling into the 4% range to 4.87% in Q4. It is expected the QSR sector cap rates will remain compressed into the first half of 2022 as this sector remains to be a highly sought-after investment opportunity.

Note: this report captures data only for transactions which have reported a sale price and capitalization rate. The data has been collected from sources deemed reliable; it may not include confidential and/or proprietary information of the marketplace.
4Q/21 Market Sales Data – By Region
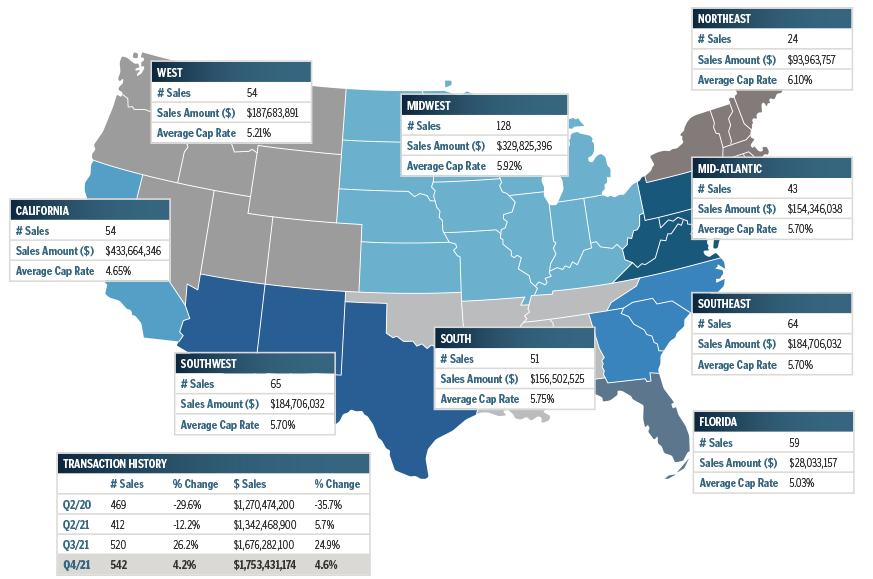
* Market totals represent the study’s sample sizes for select industries and are not indicative of all retail sales that occurred for all of 2021. Analysis has accounted for sales as reported to sources deemed reliable in the following sectors: Automotive, Bank, Casual Dining, C-Store, Dollar Stores, QSR, Medical, Pharmacy, Childcare, Fast Casual, Grocery, Big Box, and General Retail (Fitness, Hardware, Furniture, Cellular Stores, etc.). This may exclude confidential and/or proprietary information.