Market Trends Review & Forecast
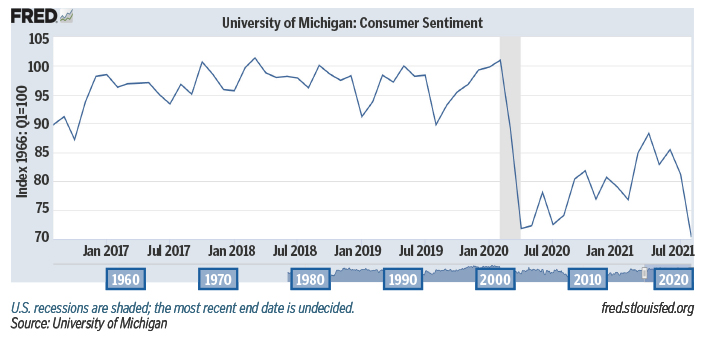
U.S. consumer sentiment fell in the month of September to 109.3, which is the lowest point seen since last February. Consumer views on both present and future economic expectations continue to downgrade and intentions on spending on big ticket items such as homes, autos and major appliances have retreated. The drop in September is also contributed to the term of inflation as there has been a 12-month gain of 5.4% in prices, a rate not seen since 2008. The University of Michigan reports the postponing of purchasing supplies is an indication of a slowdown on spending in the months ahead while stronger consumer spending is expected later in 2022.
As retail supply chain shortages have become more apparent, consumers are changing buying habits as we head into the holiday season. Consumers are buying in bulk and stocking up on items, purchasing gifts earlier and are paying closer attention to global shortages of items normal used. As a result of goods shortages, prices of goods are continuing to increase as overall CPI has increased by 5.3% since August of 2020. The Biden Administration recently announced that the Ports of Long Beach and Los Angeles will transition to a 24/7 operation to help alleviate the container backup at the Southern California Ports. As the holidays approach, expect additional actions to be taken across the country by public and private sectors to combat existing supply chain issues. Even still, retail assets remain a quality and targeted investment type for buyers ahead of expected increases in interest rates and tax reforms proposed by the Biden Administration.
2021 Key Indicators
QSR Digital Transformation
- Frequent Demand Menu Changes
- Detailed Expense Tracking
- Drive-Thru Services Accommodation
- Digital Kitchens
Grocery Stores
- Digital Orders/Contactless Payment
- Ecommerce Grocery Landscape Transformation
- New Contactless Services/Smoothie Making Machines & Salad Robots
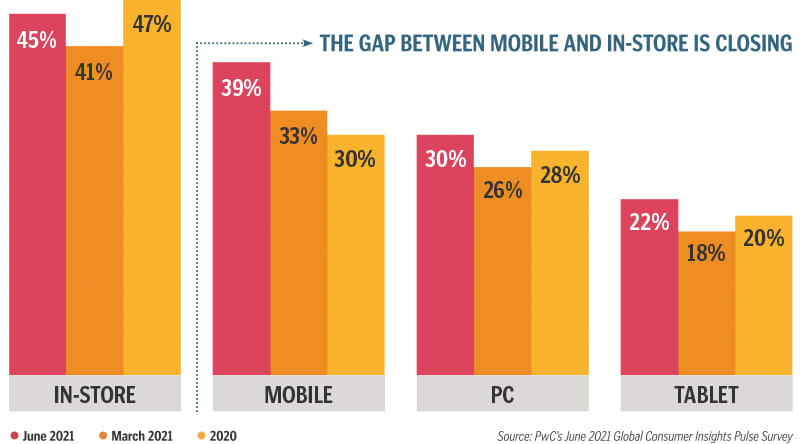
Evolving Customer Behavior
- Live Streaming Shopping/Social Commerce
- Ecommerce Sites & Contactless Payment
New Amazon Platforms
- Amazon 4 Star
- Amazon Fresh
- Amazon Pop-Up
- Amazon Go/Go Grocery
2021 Economic Review & Forecast
COVID-19 Vaccination | 215 million (55.2%) people in the U.S. have received their first dose (Oct. 2021)
Startups are Growing | 427,800 New Business Applications in August 2021 (up 69.7% YOY)
Evolving Work Force Environment | Remote Work & Space Hybrid Conversions
Liquid Deposits | Increased by 13.1% YOY since August 2020
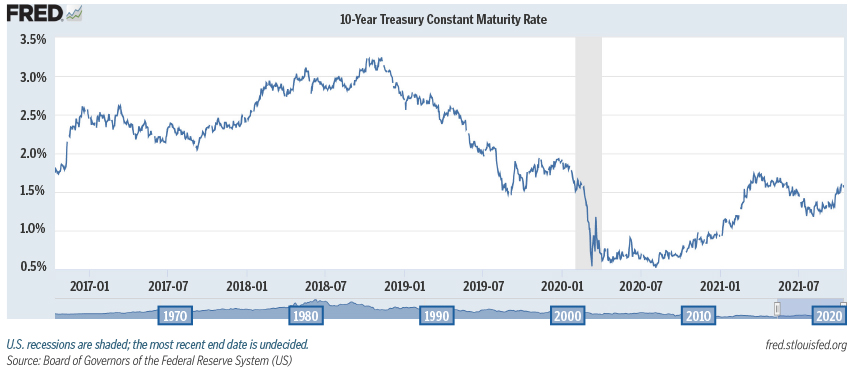
10-Year Treasury Note | Expected to rise to 1.8% in 2021, up from the current rate of 1.53%. This increase could create challenges for buyers to obtain ideal financing.
Inflation | Expected to rise 3.4% in 2021, up from 1.7% in 2020*
GDP | Expected to grow 5.5% in 2021, up from -3.5% growth in 2020*
* Source: Kiplinger Forecast & Reuters
The 10-Year Treasury continues to climb as the Fed announced they expect to increase interest rate by the end of 2022 as yields are expected to increase due to the growing pressure of inflation term. As the Democrats are in position to pass a $1.5 to $3.5 trillion infrastructure spending bill, the additional aid to funds is expected to boost economic growth and continue to push up both inflation and interest rates. The 10-Year Treasury rate is expected to rise to at least 1.8% by early next year.
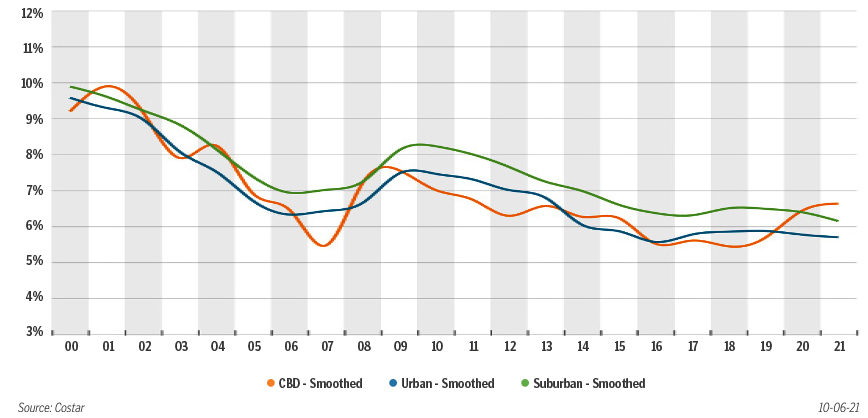
National NNN Retail Cap Rates by Location Type
Average Summary Report – Cap Rates by Industry Sector
For this report, SRS reviewed Q3 2021 sales reported by Costar for the following sectors: Automotive, Bank, Big Box/Superstore, Casual Dining, C-Store/Gas, Dollar Stores, Educational (Childcare), Fast Casual, Grocery, General Retail, Medical STNL, Pharmacy, and QSR. In Q3 it’s especially important to understand the impact the ongoing pandemic has had on the relationship between length of lease term and capitalization rates across all product types, as well as how the pandemic has affected buyer bias toward certain sectors. To do so, we compiled the following average summary reports for a number of data points throughout each mentioned sector. As can be expected, sectors classified as “essential business” with more capabilities to adapt to a changing marketplace have been less affected than others. Overall, with low interest rates ahead of an expected rise in the 10-year Treasury, combined with the pending tax reforms proposed by the Biden Administration, the market has seen an increase in trades as buyers seek to take advantage of the currently more favorable financing and tax conditions.
AUTOMOTIVE
Due to the delay issues with supply chain operations and chip shortages, the automotive industry has been directly impacted as inventory has become very limited. Despite the lack of inventory, consumer demand has remained strong. Because of the lack of automotive inventory, there has been a 25% decrease in sales compared to one year ago as 12.6 million units sold in the US in September 2021. The compression in cap rate can be attributed to steady demand for corporate guaranteed assets like AutoZone, O’Reilly Auto Parts, and other national brands.
BANK
As the bank industry recovers for the impact of COVID-19 and digital banking concepts grow, bank branches continue to pivot to new business models. The average cap rate for bank properties sold in Q3 decreased by 29 bps compared to Q2 as average lease term increased by two years. Bank institutions that made strategic technology investments prior to COVID-19 have performed stronger. Banks continue to be a focus for investors given the strong credit of the tenants.
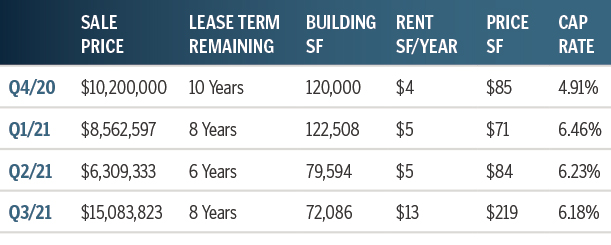
BIG BOX/SUPERSTORE
The big box sector within net lease continues to see diminished activity due to the pressure of online consumer spending and evolving smaller square footage and business restructure. Cap rates for Q3 recorded at 6.18% while the average lease term increased to eight years from six years in Q2. Since the pandemic, we have not seen a quarter with more than 10 trades in this asset type as landlords have largely decided to hold assets with high credit tenants like Walmart, Home Depot, Lowe’s, etc.
CASUAL DINING
The impact of COVID-19 has forever changed most restaurant business functions, especially the casual dining sector. Casual dining restaurants have started to resume to a new business model normalcy. Casual dining companies that were able to adapt to a fast-casual dining models have had the best success. Cap rates continue to compress in this sector with the average cap rate falling 26bps from 6.24% in Q2 to 5.98% in Q3. Pricing and overall investment demand for casual dining has increased.

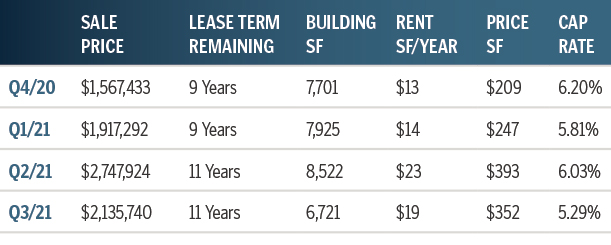
C-STORE / GAS
The c-store/gas station space remains to be a very active sector of net lease given the internet resistant foundation as well as being labeled as an essential business. Cap rates are continuing to compress with cap rates falling 21 bps in 3Q to 4.87%. Revenue for C-Stores is expected to grow at an annual rate of 2% until 2026. As more people return to work and school, the need for C-Stores will increase. This sector is expected to see secure positive activity through the end of 2021.
DOLLAR STORES
The discount dollar sector continues to be one of the most highly sought-after segments as investors continue to target assets with a strong combination of credit and yield. Expect this sector to continue to outperform other sectors as flight to safety and economic resistance remains an investment goal. In Q3, cap rates compressed 37 bps to 6.23%. While there appear to be hundreds of dollar stores on the market, there has been a noticeable decline in the availability of new stores with full term and NNN lease structures. As demand increases, investors are competitively bidding for stores during the construction period, and many off-market or pre-market stores are being sold. Given the ideal investment fundamentals, cap rates has compressed into low-to-mid 5% range for new stores. This compression is also driving down cap rates for seasoned stores.

EDUCATIONAL
The demand on the educational sector has been changing and evolving due to the impact of COVID-19. As schools continue to open their campuses to students, cap rates for educational NNN properties remained relativity flat at 6.66% in Q3 with average lease terms recording at 13 years. While there has been a growing demand on homeschool companies, more net lease investors are seeking newly developed education space to perform higher yields as on-campus restrictions are lifted.

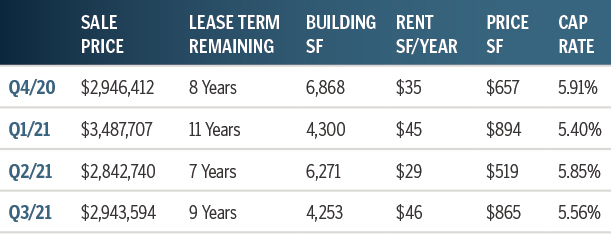
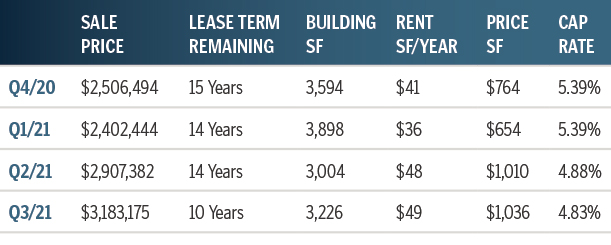
FAST CASUAL
This sector consists largely of credit-worthy brands like Panera Bread and Chipotle. These brands and others in the industry alike have been able to quickly adapt to customer demand by space remodeling, adding drive-thru to permitted spaces and provide in-app and delivery orders. While sales volume remained the same from last quarter (15 in Q2 compared to 16 sales in Q3), cap rates for this sector held steady at 4.83%. We expect to see more of the same in quarters moving forward as developers and investors seek sites suitable for and/or equipped with new drive-thru prototypes for these brands.
GENERAL RETAIL
General retail sectors include fitness, hardware, furniture, home goods, cellular stores and other retail types which do not fall under one of the other focused sectors. Average cap rates have stayed historically consistent in the mid 6% range while recording at 6.68% in Q3. The number of properties trading hands in this sector increase back to historical averages, demonstrating how investors are again looking at the net lease retail sector in general as an attractive, low or zero-management investment market with stable cash flow & sizable returns.

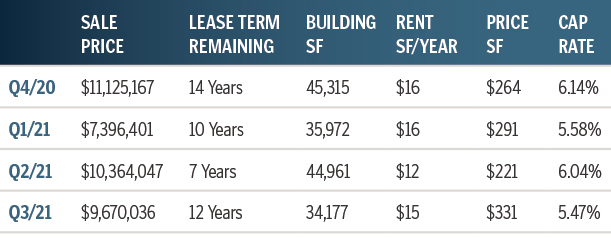
GROCERY
Given the essential nature of the grocery sector that provides a safe and stable recession resistant asset, investors continue to look at this sector as stable cash flow. Average cap rates decreased by 57 bps to 5.47% during Q3 due to increased flight to higher priced markets with most grocery store assets featuring strong, high credit tenants – Whole Foods, Kroger, Albertsons, Sprouts, Aldi etc. This sector is expected to see secure activity into 2022, however it is expected future supply chain issues could have an impact on sales.
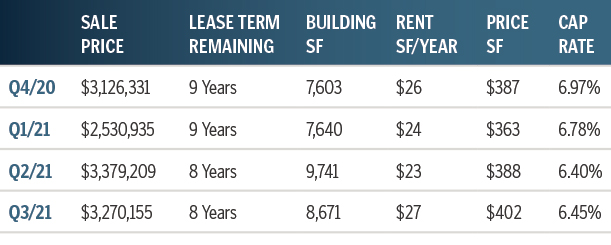
MEDICAL STNL
Given the medical industry has been deemed as one of the most important sectors due to the correlation impact of COVID-19, single tenant net leased medical properties average cap rates held steady, recording at 6.45% in Q3. Moving into the end of 2021, cap rates are expected to remain steady as most sales transactions in this sector are trading hands in suburban markets. As sales transactions grow into metropolitan markets, we can then expect to see a compression in cap rates.
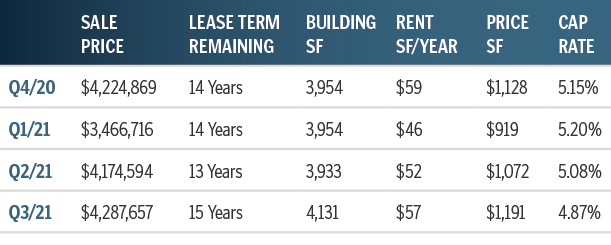
PHARMACY
Average cap rates for pharmacy net leased assets slightly decreased by 18 bps in Q3 falling into the 5% range to 5.97%. As pharmacy stores are being looked at as another shopping alternative for consumers and pharmacists roles have changed given their accessibility to the public as health care professions, it is expected cap rates will remain relatively flat or slightly compressed into the first half of 2022. This sector is largely dominated by Walgreens transactions, and we expect to see the same over the coming months.

QSR
QSR remains a steady and highly sought-after asset type given the sector’s minimal need for adaption compared to other food service providers. Further, QSRs typically offer a lower price point and a higher percentage of absolute NNN lease types for investors compared to other sectors. Cap rates continue to compress, decreasing 15 bps in Q3 to 5.22%. It is expected the QSR sector cap rates will remain slightly compressed into the first half of 2022.

Note: this report captures data only for transactions which have reported a sale price and capitalization rate. The data has been collected from sources deemed reliable; it may not include confidential and/or proprietary information of the marketplace.
YTD Market Sales Data – By Region
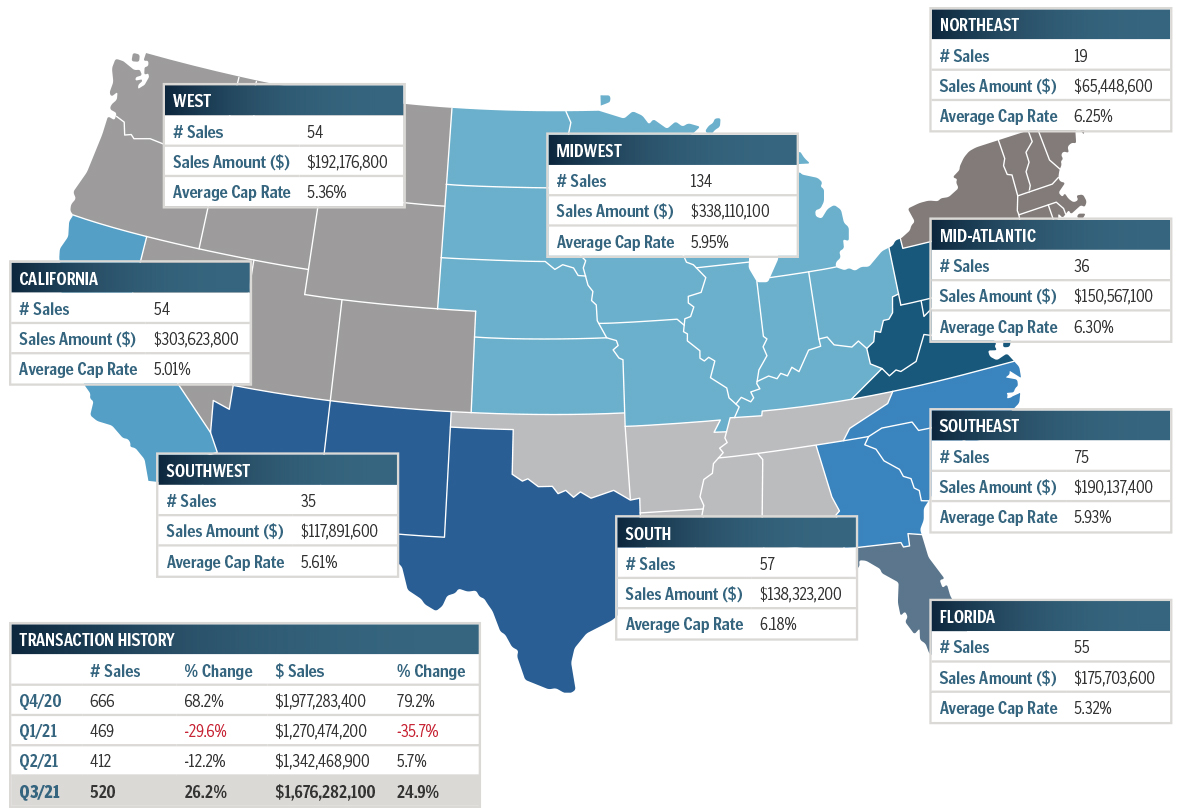
* Market totals represent the study’s sample sizes for select industries and are not indicative of all retail sales that occurred for all of 2021. Analysis has accounted for sales as reported to sources deemed reliable in the following sectors: Automotive, Bank, Casual Dining, C-Store, Dollar Stores, QSR, Medical, Pharmacy, Childcare, Fast Casual, Grocery, Big Box, and General Retail (Fitness, Hardware, Furniture, Cellular Stores, etc.). This may exclude confidential and/or proprietary information.